Oil Analysis & Comparisons
Typically analysis of essential oils is done by GC-FID/MS using a capillary column, and presented as a peak area % of the total summed peak areas. The Graph below shows tabulated peak area data from a high β-triketone Manuka oil, a low β-triketone Manuka oil, and comparisons with Kanuka (Kunzea ericoides) and Australian Tea Tree oil (Melaleuca alternifolia, TTO). This demonstrates how significantly different they are from both Manuka and each other.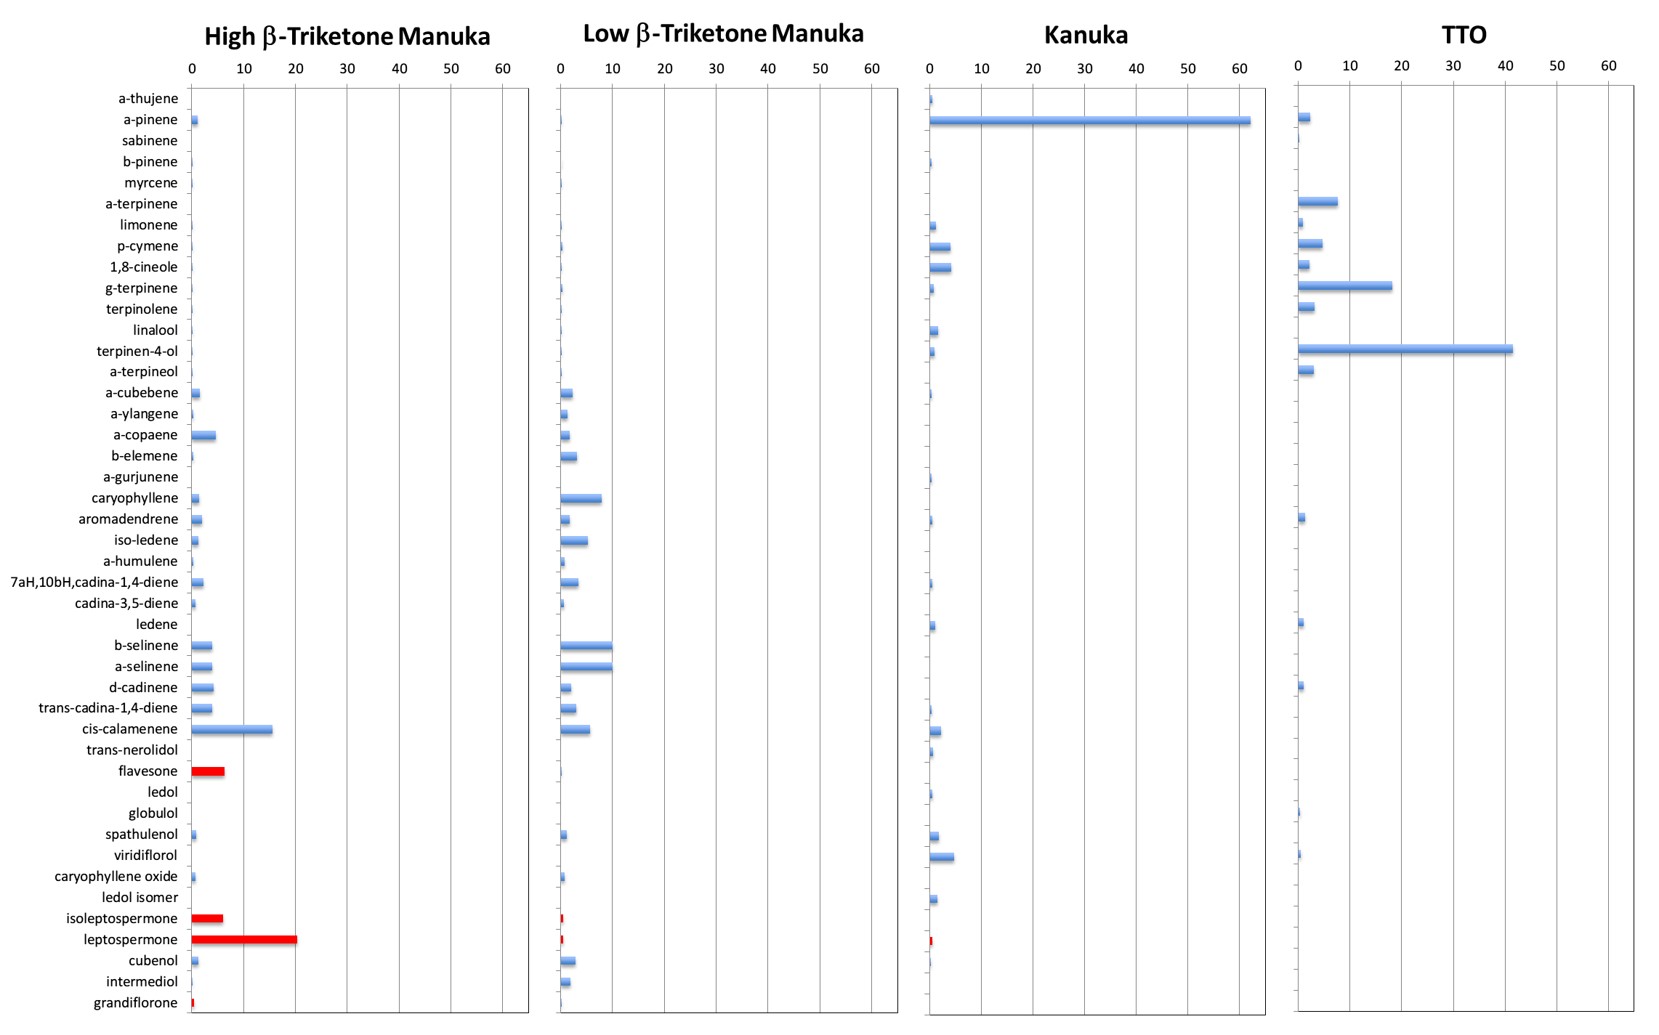
Comparisons of oils and compounds of high β-triketone East Cape Manuka oil, low β-triketone Manuka oil, Kanuka oil & Australian Tea Tree oil (TTO)
(β-triketones in RED – click graph to view larger)
The individual GC-FID chromatograms for these essential oils (that this data above is derived from) can be seen by clicking the respective graphs below. These graphs also reveal the myriad of compounds that make up these essential oils, and show how complex most essential oils are - having many compounds that have individual, additive & synergistic properties.

Chromatograms of high β-triketone East Cape Manuka oil, low β-triketone Manuka oil, Kanuka oil & Australian Tea Tree oil
(Click graphs to view larger)
Additionally a good study comparing the constituents of Manuka to Kanuka can be found in the paper by Porter & Wilkins et al.27. From this in Table 1 is a comparison of the major constituents for East Cape Manuka and Kanuka respectively with TTO (M. alternifolia). This table, the GC-FID chromatograms and Graph 1 show how dramatically different these oils are in their chemical compositions. Seasonal variations in the composition of East Cape Manuka oil is also known and reported by Douglas et al.19
TTO has been included here as it has be shown to beneficial synergistic properties when combined with Manuka. The patented mixture known as LEMA® Oil28 utilises the complementary properties of the most active fractions of high triketone East Cape Manuka oil and Australian TTO to give a better broader antimicrobial response when used.
Table 1: Comparison of major essential oil compounds in Manuka, Kanuka & Australian Tea Tree
| Compound | Manuka | Kanuka | Tea Tree (Aus) |
| α-pinene | 1.3 | 55.5 | 3.5 |
| ρ-cymene | 0.2 | 3.4 | 4.3 |
| sabinene | 0 | 0 | 1.8 |
| α-terpinene | 0 | 0 | 9 |
| 1,8-cineole | 0.2 | 3.9 | 7.5 |
| limonene | 0.1 | 3.9 | 1.0 |
| γ-terpinene | 0.2 | 2.5 | 19.0 |
| terpinolene | 0 | 0 | 3.3 |
| terpinen-4-ol | 0 | 0.2 | 39.0 |
| α-terpineol | 0.1 | 0.9 | 4.8 |
| α-cubebene | 4.0 | 0.2 | |
| α-copaene + γ-yaylangene | 5.9 | 0.6 | |
| α-gurjunene | 1.0 | 0.4 | |
| β-caryophyllene | 2.6 | 0.5 | |
| aromadendrene | 2.1 | 0.5 | 1.5 |
| cadina-3,5-diene | 4.9 | 0.5 | |
| δ-amorphene | 3.8 | 0.5 | |
| β-selinene | 3.7 | 0.3 | |
| α-selinene (+ viridiflorene) | 4.4 | 2.4 | 1.5 |
| calamenene | 14.4 | 3.0 | |
| δ-cadinene | 6.0 | 1.0 | 1.5 |
| flavesone β-triketone | 4.9 | 0 | |
| cadina-1,4-diene | 5.9 | 1.3 | |
| β-nerolidol | 0.2 | 1.8 | |
| spathulenol | 0.5 | 1.3 | |
| viridiflorol | 0.5 | 7.2 | 0.5 |
| ledol | 0.2 | 1.9 | |
| isoleptospermone β-triketone | 4.6 | 0 | |
| leptospermone β-triketone | 15.5 | 0 | |
| Total β-triketones (MßTK) | 25 | 0 | 0 |
NB: Kanuka & Manuka results from Porter & Wilkins27.
Australian Tea Tree oil (M. alternifolia, TTO) results is the average of the ISO 4730 standard29.
Shaded areas represent principle constituents.